See What Sells.Scale What Works.
Discover hidden revenue opportunities with FlexiFunnels' Advanced Analytics & Reporting Dashboard. Track, analyze, and optimize every step of your customer journey with confidence and grow faster.
Without Data Analytics, You're Flying Blind
FlexiFunnels' Analytics Dashboard transforms complex data into actionable insights, empowering you to make decisions based on facts, not assumptions.

Complete Visibility
Track every visitor, lead, and customer interaction across your entire funnel with precision.
- Page Views & Unique Visitors
- Checkout Views (all & unique)
- Sales & Revenue Tracking
Performance Metrics
Measure what matters with advanced metrics that reveal revenue opportunities and conversion leaks.
- Earnings per Visitor
- Conversion Rates by Funnel Stage
- Average Order Value
Opportunity Alerts
Identify and fix revenue leaks with smart alerts that highlight areas needing optimization.
- Refund Rate Monitoring
- Cart Abandonment Tracking
- Conversion Leak Detection
The Hidden Cost of Flying Blind
Without proper analytics, businesses lose 20-30% of potential revenue. FlexiFunnels reveals those missed opportunities.
The Problem
Guessing Where Visitors Drop Off
Without visibility into your funnel, you're making expensive guesses about where to optimize.
Missing Revenue Leaks
Cart abandonment, low conversion pages, and customer drop-offs are silently draining your revenue.
No A/B Testing Insights
Without proper split testing, you're missing opportunities to boost conversions by 30-150%.
Wasted Ad Spend
Without conversion tracking, up to 40% of your marketing budget may be wasted on underperforming campaigns.
The Solution: FlexiFunnels Analytics
Complete Funnel Visibility
Track every step from page view to purchase with precise metrics that reveal exactly where to optimize.
Revenue Leak Detection
Automatically identify and fix conversion drop-offs with cart abandonment recovery and optimization alerts.
Advanced Split Testing
Test up to 10 variations with custom traffic allocation to scientifically increase conversions by 30-150%.
Marketing ROI Optimization
Track campaign performance with precise attribution to eliminate wasted ad spend and scale what works.
Average ROI with FlexiFunnels Analytics
317%
Powerful Analytics Features That Drive Growth
FlexiFunnels provides comprehensive analytics dashboards that transform raw data into actionable insights.
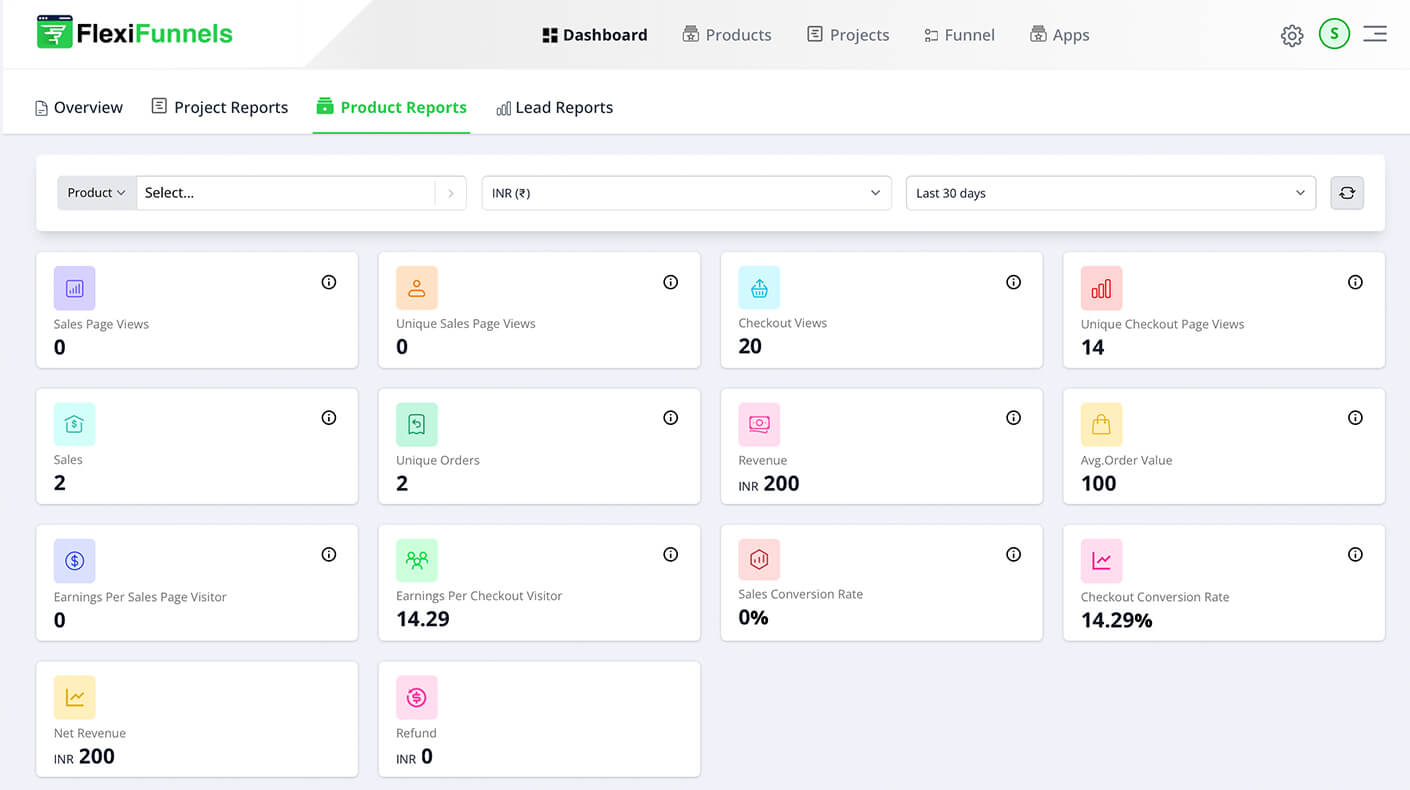
Product Dashboard
- Comprehensive search & filtering
- Page view & visitor tracking
- Sales & revenue metrics
- Conversion rate analysis
- Refund monitoring
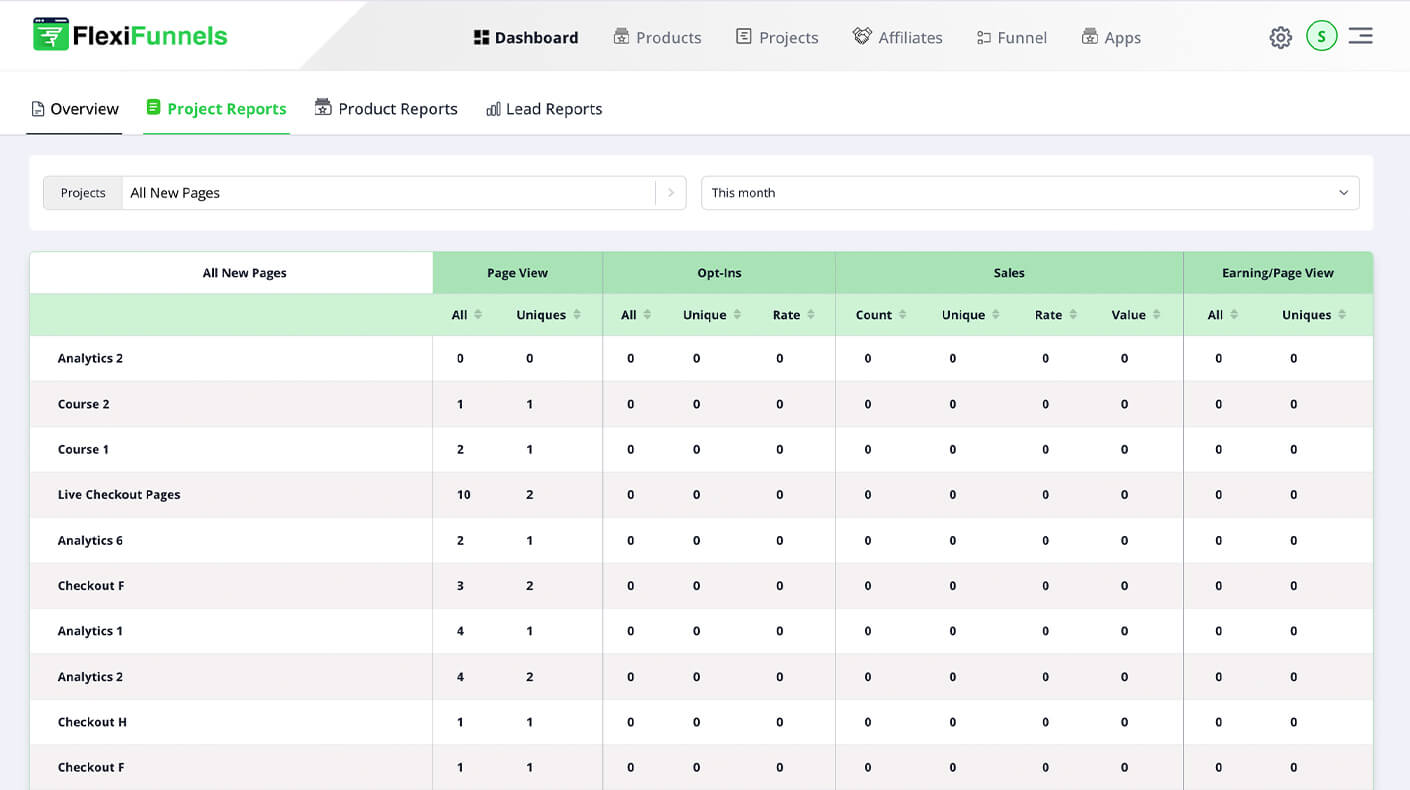
Project Dashboard
- Multi-project filtering
- Page views & lead tracking
- Page-specific conversion rates
- Revenue per page view
- Earnings per visitor
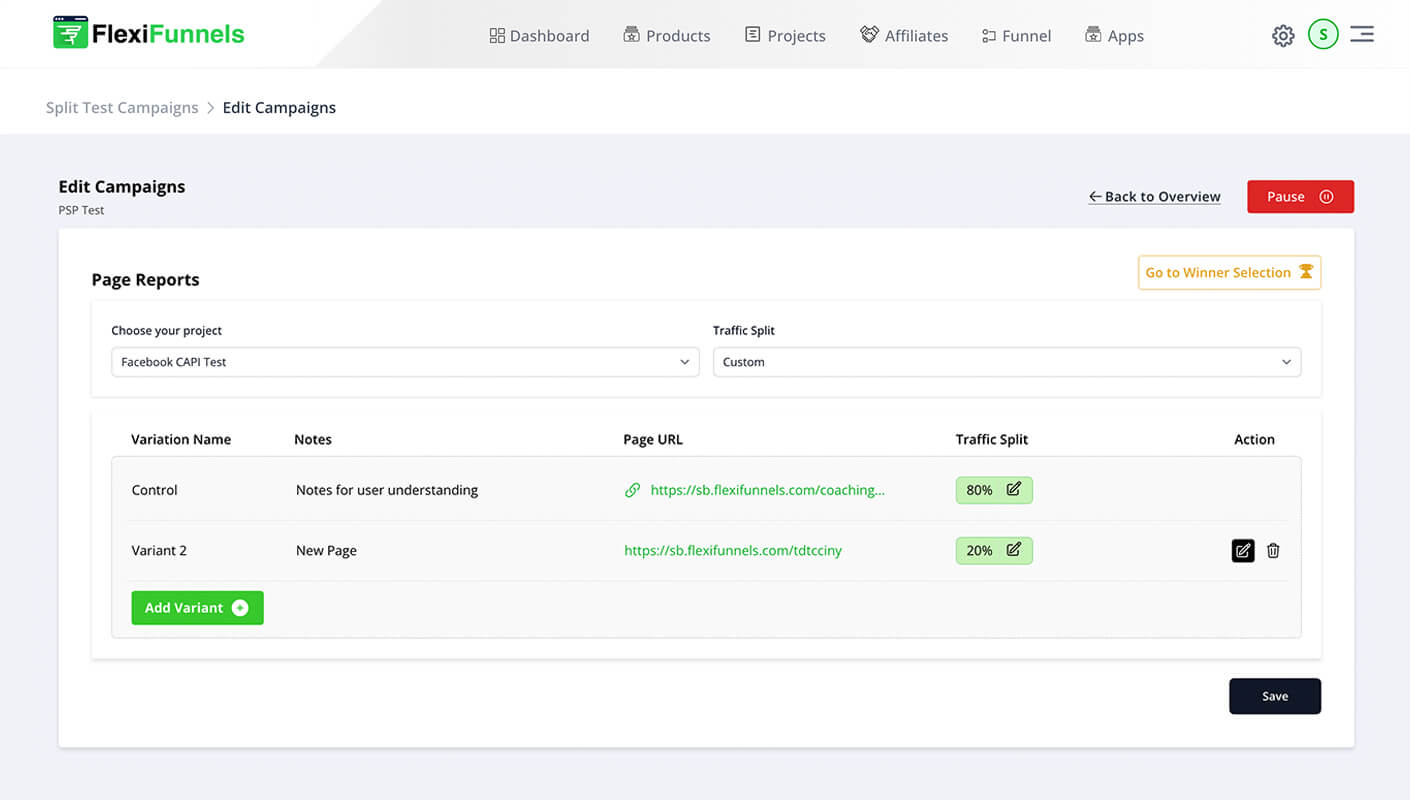
A/B Split Testing
- Test up to 10 variations
- Custom traffic allocation
- Conversion metrics by variation
- Statistical confidence scoring
- One-click winner selection
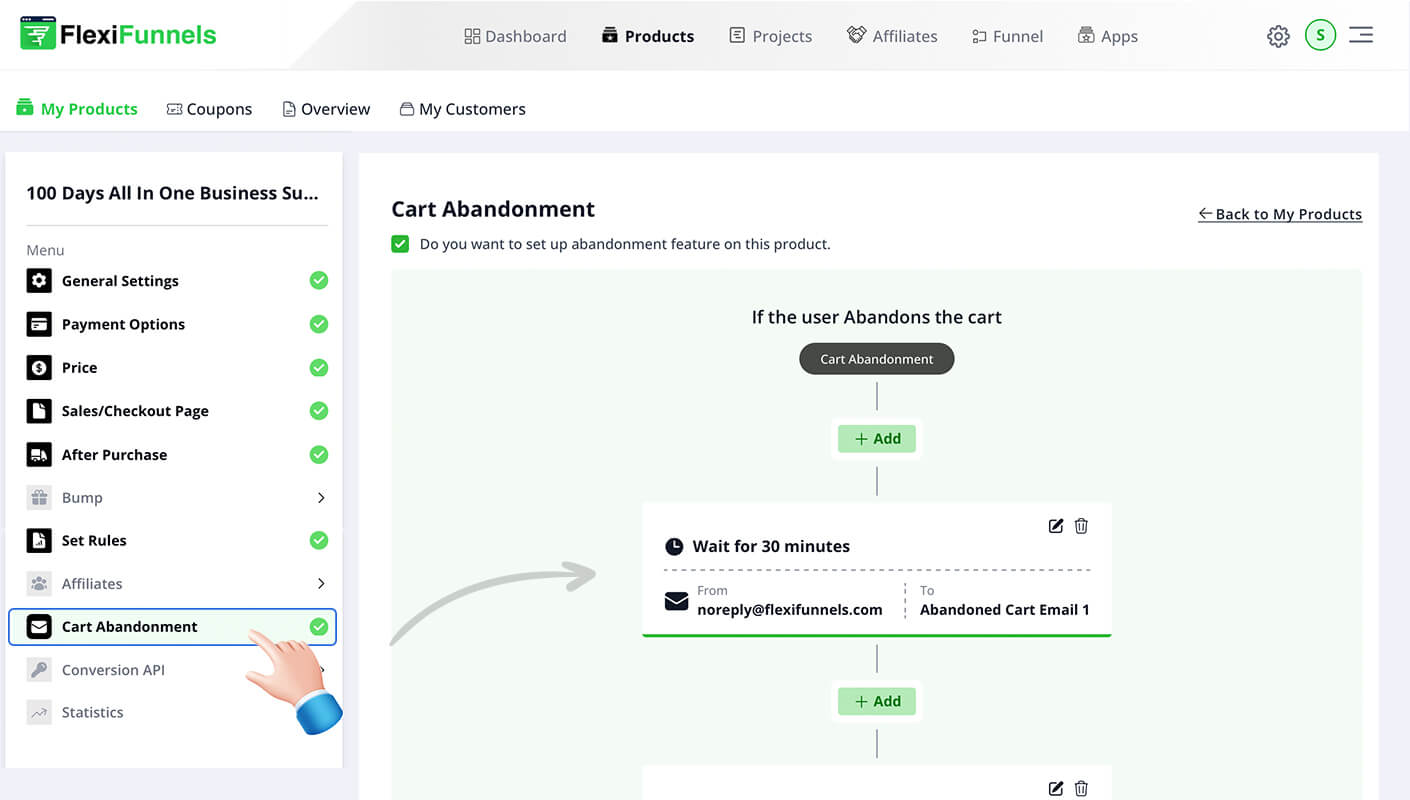
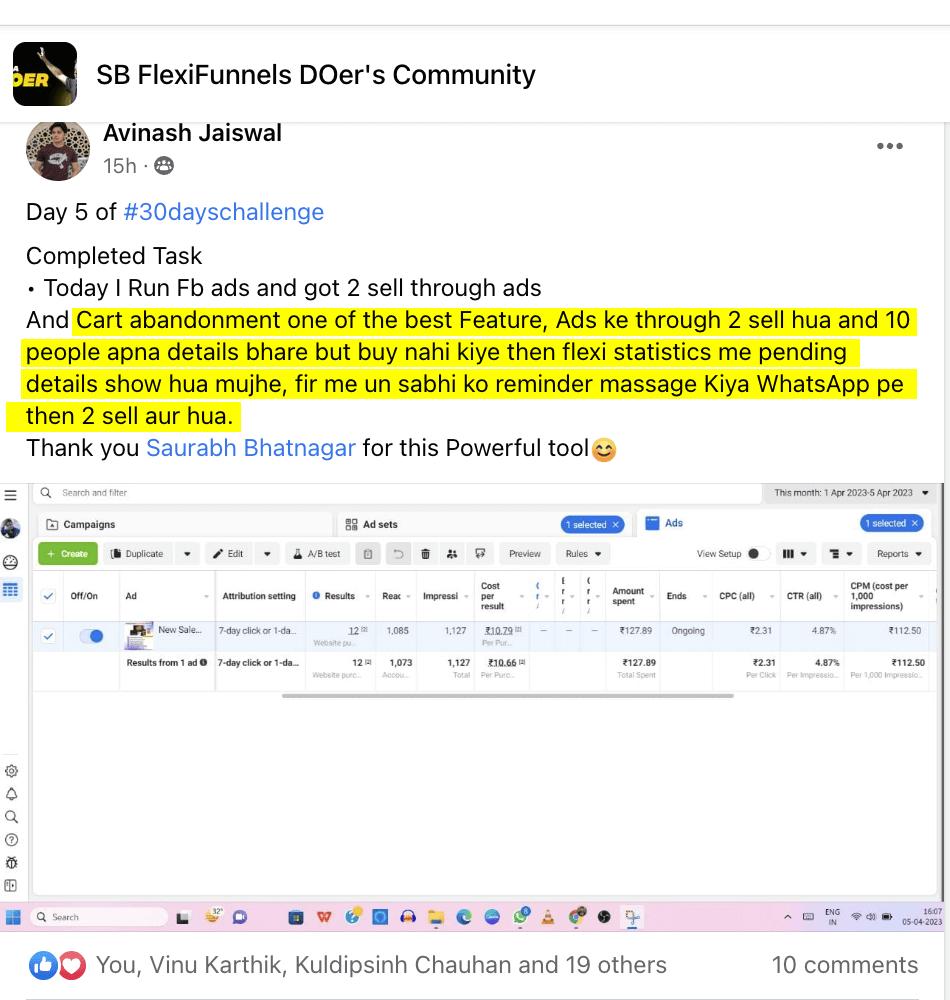
Cart Abandonment Recovery
- Real-time abandonment tracking
- Automatic recovery sequences
- Abandonment rate analytics
- Recovery performance metrics
- Recovered revenue tracking
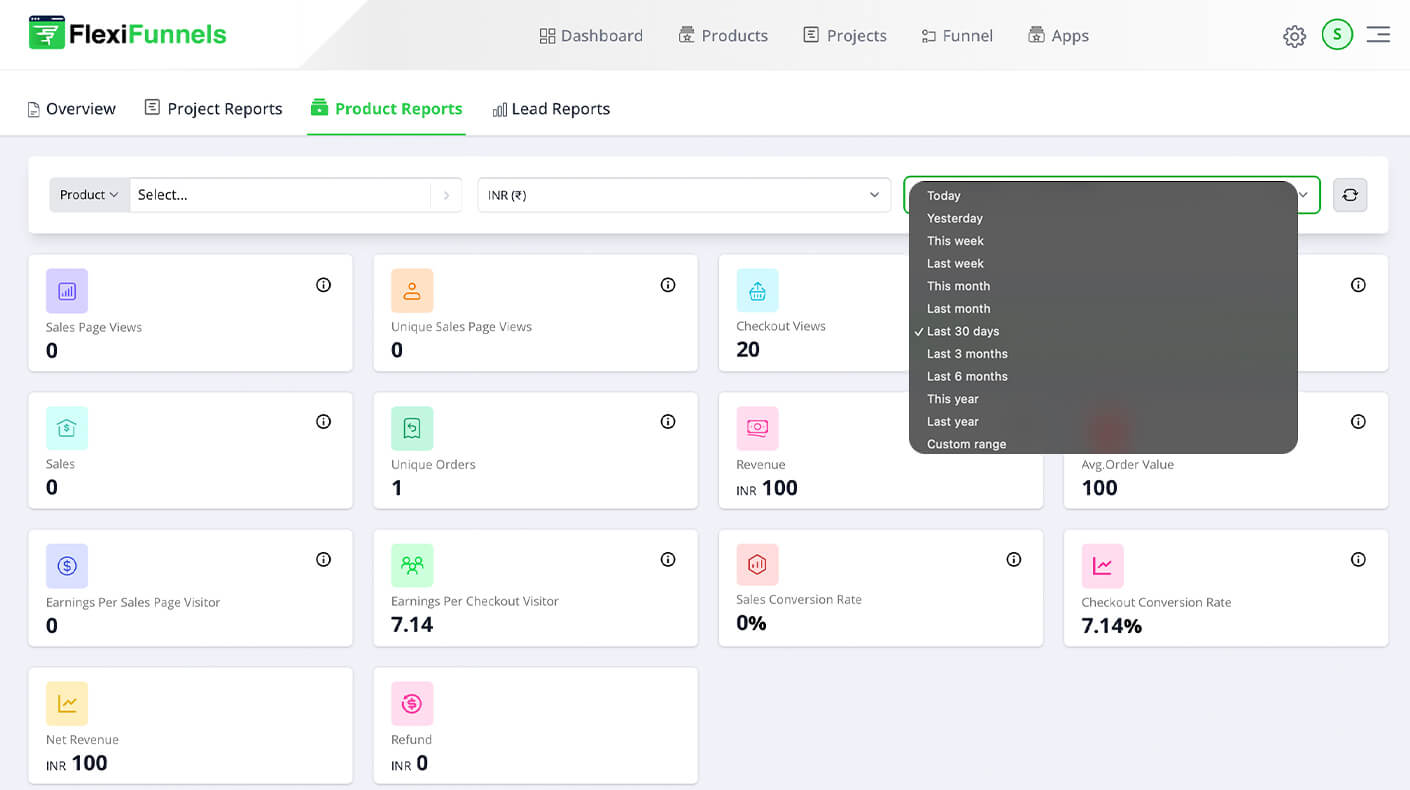
Advanced Date Filters
- Today / Yesterday
- This Week / Last Week
- This Month / Last Month
- Last 30/90/180 Days
- Custom Date Ranges
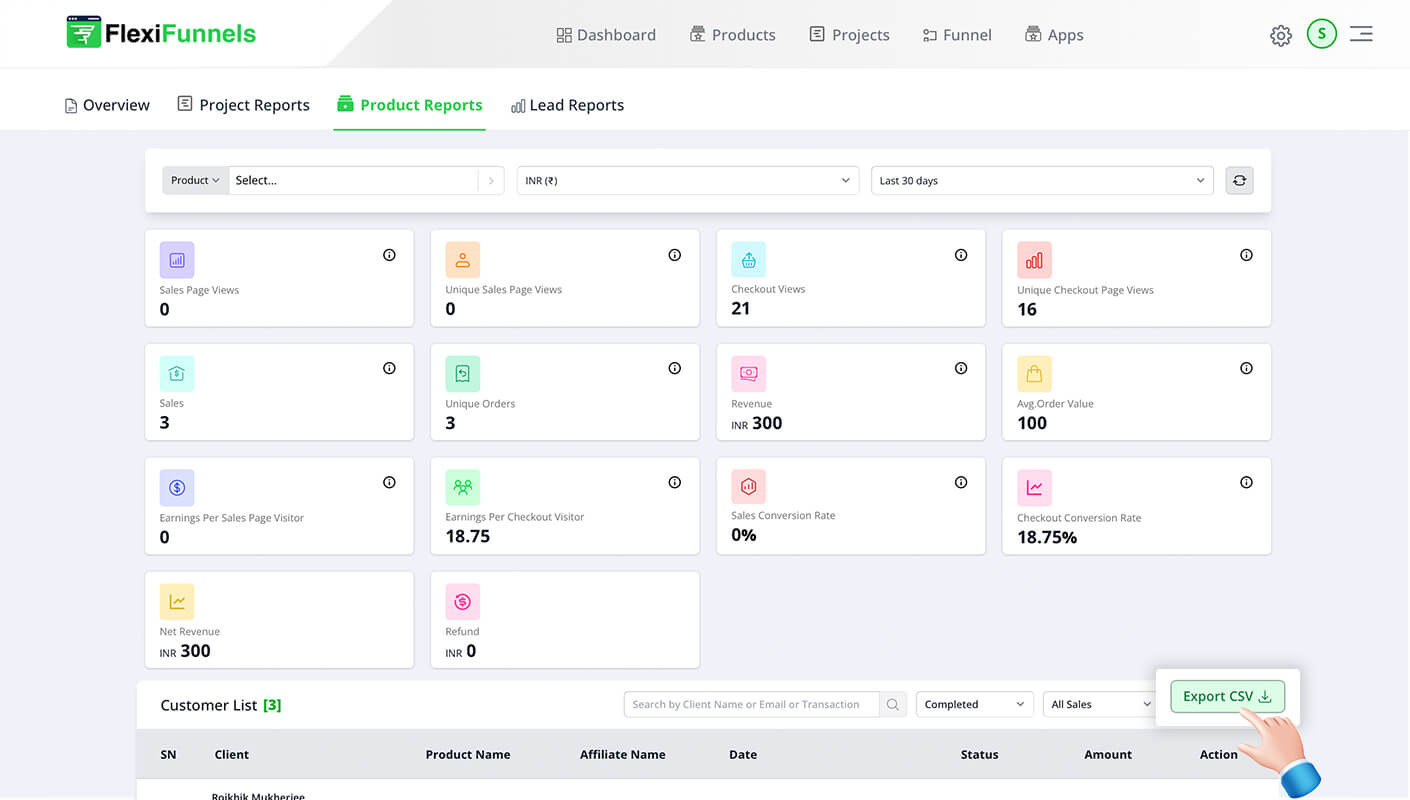
Data Export & Reporting
- One-click CSV exports
- Filter-specific exports
- Lead data extraction
- Revenue report generation
- Custom report scheduling
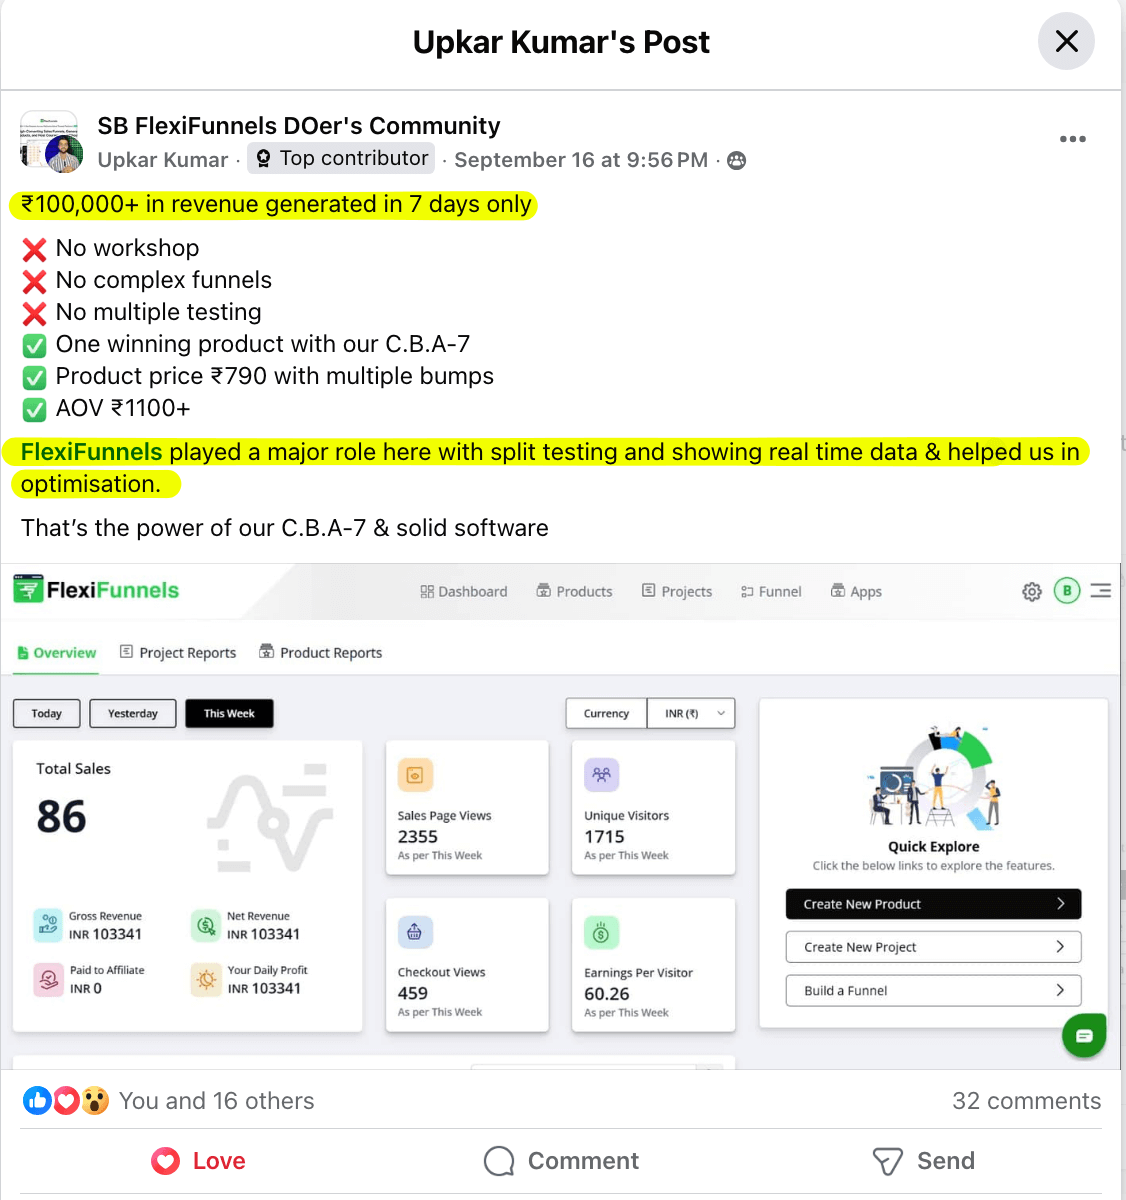
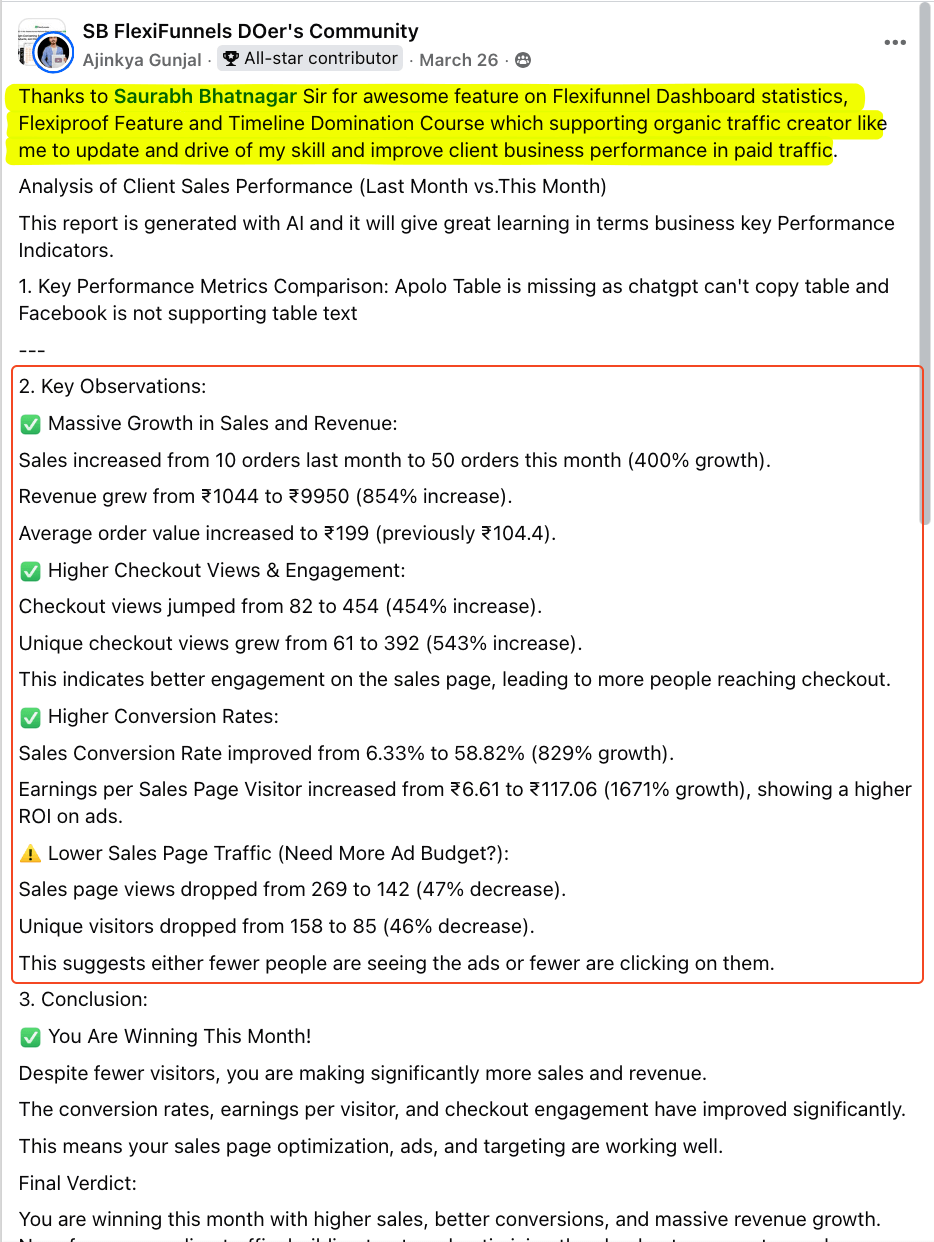
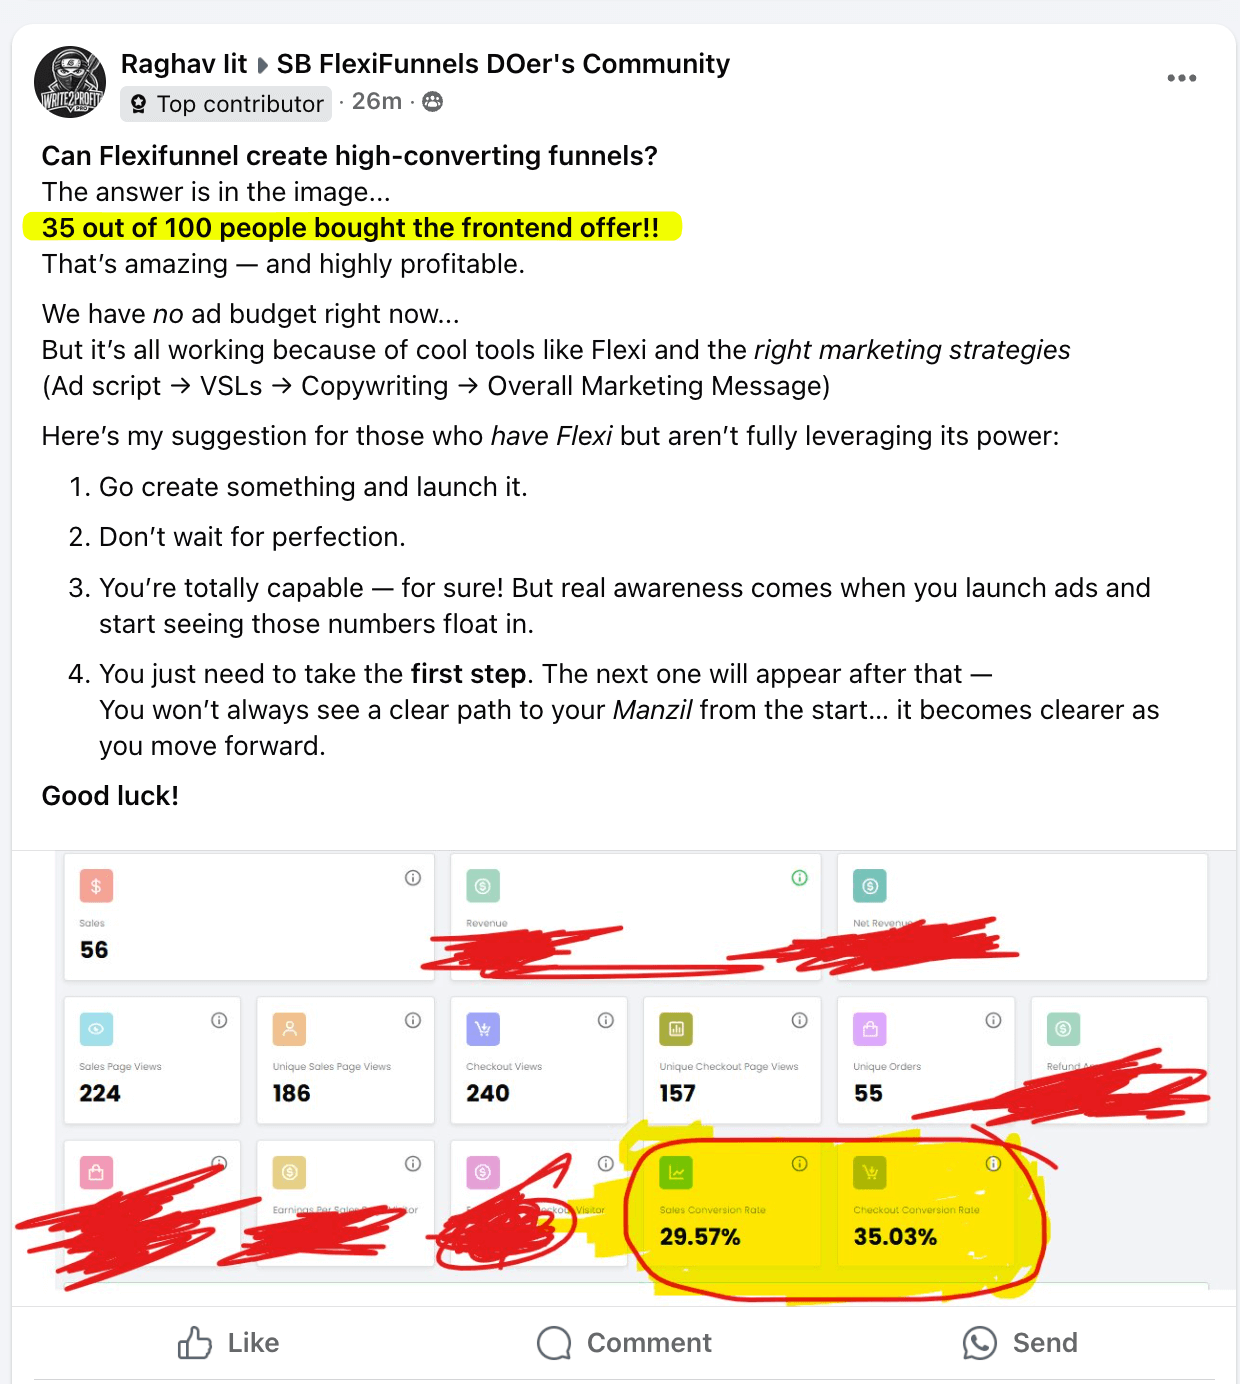
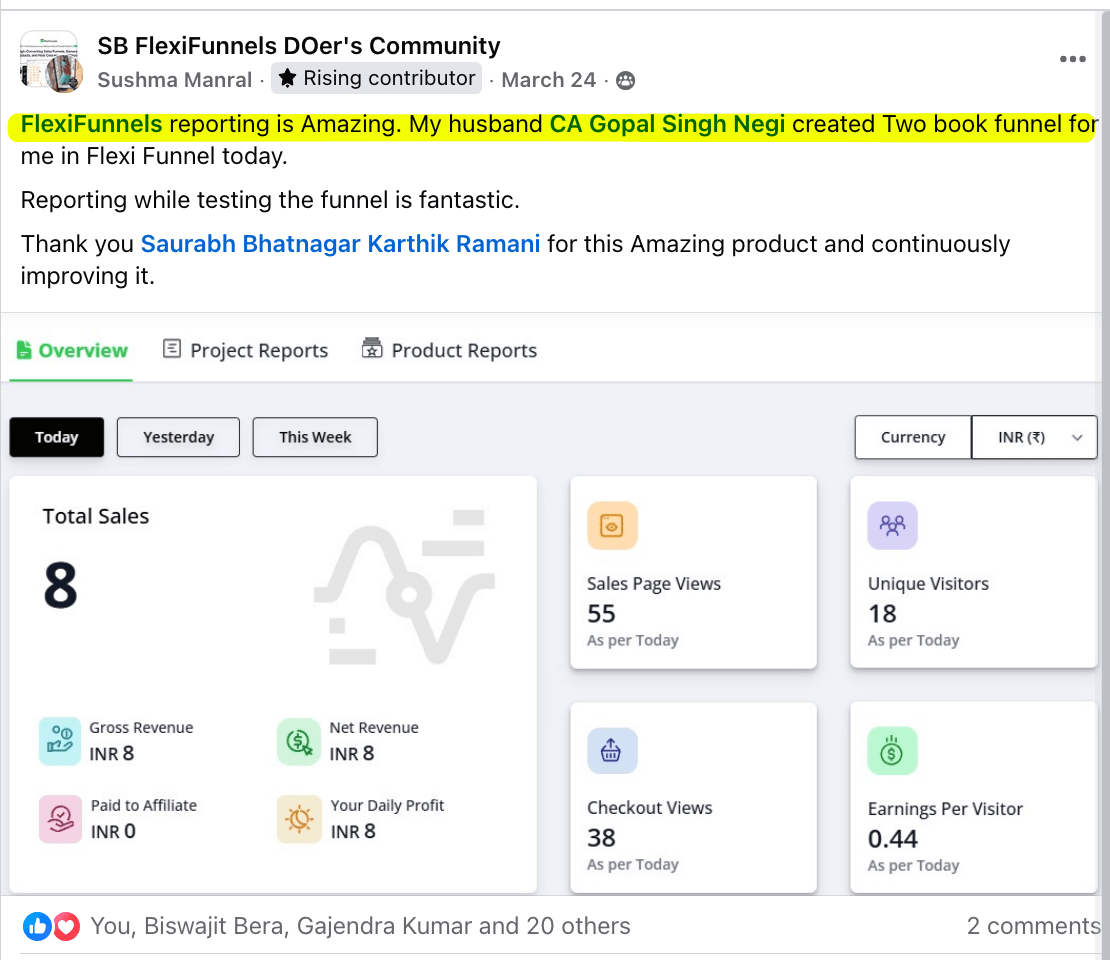
Businesses Thriving With Our Analytics
See how customers are achieving breakthrough results by making data-driven decisions with FlexiFunnels.


No credit card required to get started
Advanced A/B Split Testing Analytics
Test up to 10 variations of your pages and funnel steps with custom traffic allocation to find the highest-converting version.
Recommended Action
Variation D is the clear winner with 98% confidence. Click to implement this version across all traffic.
Why Split Testing Is Your Secret Weapon
Test Multiple Variations Simultaneously
Unlike basic tools that only test A vs B, FlexiFunnels lets you test up to 10 variations at once, helping you find the winner faster.
Custom Traffic Allocation
Allocate traffic however you want—equal splits, weighted distribution, or more traffic to promising variations.
Statistical Confidence Scoring
Our algorithms automatically calculate when a test has reached statistical significance, so you know when to end the test.
One-Click Implementation
When a winner is identified, implement it across all traffic with a single click—no need to manually rebuild pages.
Revenue Impact Calculation
See the projected annual revenue impact of each variation, helping you prioritize tests by potential ROI.
Powerful Product Dashboard Analytics
Track and analyze every product's performance with comprehensive metrics that help you optimize your entire product catalog.
Product Performance Dashboard
Top Performing Products
Conversion Rates by Product
Product Insights
Premium Course has the highest conversion rate (8.7%) and revenue ($12,845). Consider creating upsell opportunities for this product.
Optimize Your Product Strategy with Data
Comprehensive Product Analytics
Track sales, revenue, conversion rates, and customer behavior for every product in your catalog with detailed metrics.
Performance Comparison
Compare products side-by-side to identify top performers, underperforming products, and optimization opportunities.
Refund Monitoring
Track refund rates by product to identify quality issues or misaligned customer expectations that need addressing.
Revenue Optimization
Identify which products drive the most revenue and profit, allowing you to focus your marketing efforts on high-value items.
Product Insights
Get AI-powered recommendations for product improvements, pricing strategies, and bundle opportunities based on performance data.
Comprehensive Project Dashboard Analytics
Monitor all your marketing projects in one place with detailed metrics that help you optimize performance and scale what works.
Project Performance Dashboard
Project Performance
Conversion Rates
Project Insights
Webinar Funnel has the highest conversion rate (9.2%) and revenue ($18,472). Consider scaling ad spend for this project by 25%.
Maximize Your Marketing ROI with Project Analytics
Multi-Project Tracking
Monitor all your marketing campaigns, funnels, and initiatives in one centralized dashboard with comprehensive filtering options.
Page-Level Analytics
Track visitor engagement, conversion rates, and revenue for every page in your project to identify optimization opportunities.
Performance Comparison
Compare projects side-by-side to identify your most profitable marketing initiatives and allocate resources accordingly.
Revenue Metrics
Track earnings per visitor (EPV), revenue per page view, and total project revenue to measure financial performance.
Growth Opportunities
Receive AI-powered recommendations for scaling successful projects and optimizing underperforming ones.
Common Questions About Analytics
We've answered the most common questions about implementing advanced analytics and reporting.
Is the analytics dashboard difficult to understand?
Not at all. FlexiFunnels was designed with simplicity in mind. Our dashboard presents complex data in an intuitive visual format with clear explanations. You don't need to be a data scientist to extract valuable insights—we've made data analysis accessible to everyone.
Will implementing analytics slow down my pages?
No. Our tracking code is lightweight and loads asynchronously, meaning it has zero impact on your page load times or user experience. All the heavy data processing happens on our servers, not in your visitors' browsers.
Do I need technical skills to set up tracking?
Absolutely not. FlexiFunnels automatically sets up all tracking when you build your pages and funnels in our system. There's no code to install, no pixels to configure, and no technical setup required. Everything just works out of the box.
How accurate is the data compared to Google Analytics?
Our tracking is typically more accurate than Google Analytics because we don't get blocked by ad-blockers or privacy plugins. Plus, we track the full customer journey across your funnel, including specific conversion events that Google Analytics often misses.
Will I be overwhelmed with too much data?
We've carefully designed our dashboard to show you only what matters most. You'll see high-level metrics at a glance, with the ability to drill down into details when needed. Plus, our AI-powered insights highlight the most important opportunities automatically.
Can I export the data for my team or clients?
Yes! All data can be exported to CSV with a single click. You can export specific date ranges, filter data before exporting, and create custom reports. This makes it easy to share insights with team members or include analytics in client reports.
Stop Flying Blind With Your Marketing
Get complete visibility into your funnel performance and unlock hidden revenue opportunities today.
Increase Conversions
Find and fix conversion leaks to boost your sales by 20-300%.
Data-Driven Decisions
Make confident marketing decisions based on real data, not guesswork.
Maximize ROI
Identify your highest-performing marketing channels and scale what works.